

In 2023, Rock Content’s Marketing team implemented a testing routine to foster a Growth Hacking perspective among its members, encouraging them to create hypotheses for improvements and test them.
All of this, of course, followed a reliable, data-based method.
I’m not a UX expert. Despite having taken statistics classes in college, analyzing data in a structured way wasn’t something I was familiar with as a Creative Designer at Rock Content until then.
Even so, I accepted the challenge and started thinking about some hypotheses to test. In this article, I will explain:
- How I helped increase our click-through rate by 50% by changing the position of a banner on our blog.
- How, even though I’m not a Growth Hacking expert, I managed to acquire and implement a testing mentality to bring more results to my work.
This article will go straight to the point. However, if you want more context about what Growth Hacking or A/B Testing is, I recommend reading this article and this one too.
The Hypothesis
After some brainstorming, I prioritized testing the position of a CTA on Rock Content’s blog. This prioritization followed the ICE Score methodology, which involves estimating based on three parameters: Impact (how much the test result can affect metrics or the test object itself), Confidence (our level of confidence in the success of the test), and Ease (how easy it would be to implement the test).
Compared to my other test ideas, changing the position of the CTA from the sidebar to the fixed footer had the highest ICE Score.
In the following image, you can see the CTA with the message “Human Crafted Content: Find top content freelancers on WriterAccess. Try for free” on the right side of the blog.
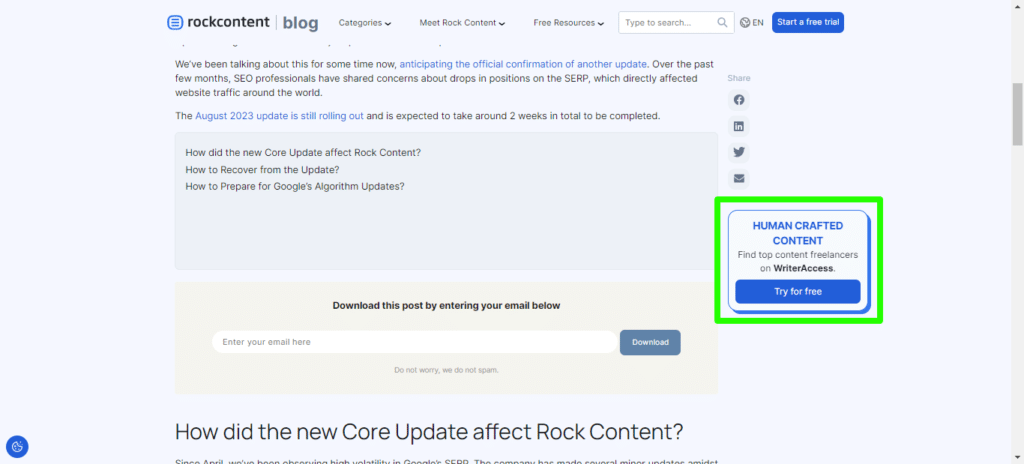
The question I asked myself was: is there any other position where this CTA would be more visible to the user?
From this, I developed a hypothesis with the following premises:
- The Sidebar Placement: The sidebar on the right, due to visual hierarchy, is generally a place for secondary and/or complementary content, as pointed out in this article published by the Norman/Nielsen Group:
“The right-hand side of the page consumes maybe 20% of your available pixels: the most precious resource on computers. It can serve many significant and practical purposes. It’s a place to feature secondary content — to recommend or extend the user’s journey to other areas of your site.”
2. Banner Blindness: The content contained there may go unnoticed by the user, who is used to looking away from banners and advertisements (or elements on the page that resemble them):
“People disregard colorful boxes in the margin of the page because such graphical treatments are commonly applied to ads. In fact, anything that’s overly large or colorful risks being ignored, and user attention tends toward the left side of pages. In usability studies, we frequently observe users overlooking items they need even when these items are in plain sight. When questioned after the study, they tell us again and again, ‘I saw that, but it looked like an ad, so I ignored it.’”
3. Centralized Main Content: The main content of the blog post is found in a centralized area of the page, but when there are two columns within this area, the text is in the left column. To reach the end of the article, the user needs to scroll to the bottom of the page.
These premises then generate the following hypothesis:
By leaving the CTA fixed to the bottom of the screen, we can take advantage of the scrolling action to increase our click-through rate.
When the CTA is in a sidebar, it can easily escape the user’s attention, assuming the main content is in a larger area on the left of the page and the user scrolls down to continue reading. In other words, when reading the text, the user keeps the CTA close to their field of vision at all times.
Before starting the tests, I looked for examples of websites that used a fixed bar at the base. I found some examples, of which I highlight:
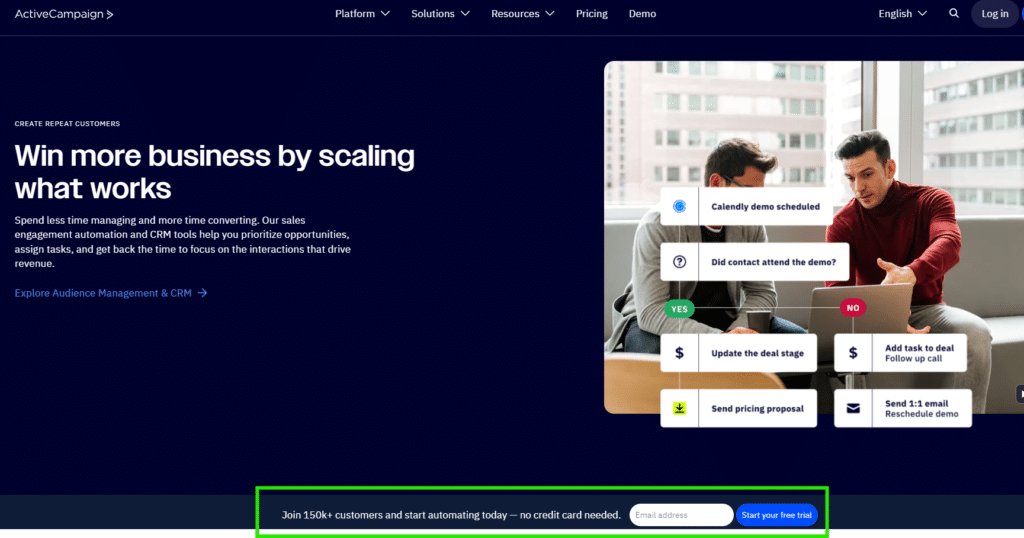
Active Campaign
The email marketing and CRM automation platform already places a form field and a CTA for the free trial period in the fixed footer (highlighted in green in the image below).
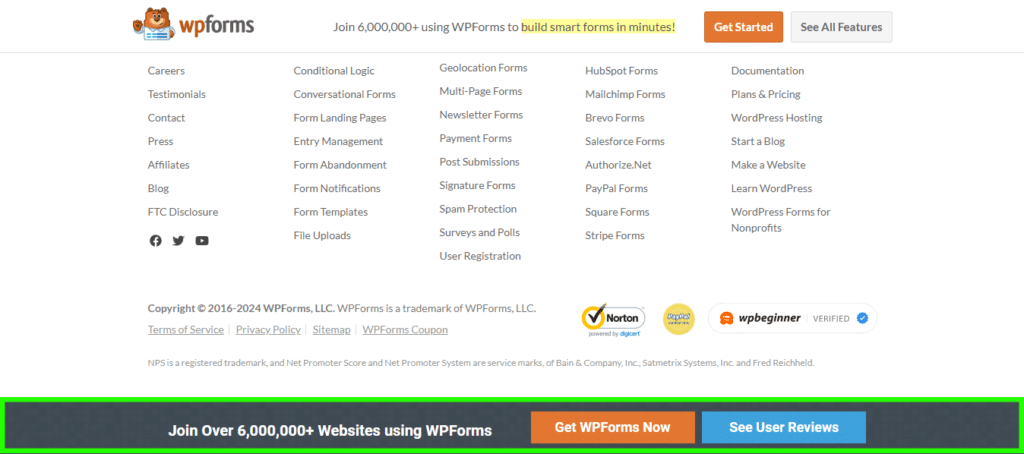
WPForms
WPForms is a plugin that facilitates the construction and implementation of forms within websites made with WordPress. In the fixed bar, they placed two CTAs: one to purchase the plugin and another directing users to reviews.
The Test
The time had come to put the hypothesis to the test.
To do this, we had to establish the parameters to be tested and the success criteria.
With the help of our testing analyst (oh, right—Rock Content takes this so seriously that we have a person on the Marketing team focused exclusively on testing), we decided to comparatively analyze the click rate between the CTA on the sidebar and on the fixed footer.
We set a target of at least a 10% increase in the footer bar rate compared to the sidebar rate. Statistically, this would prove that the fixed bar is more effective in driving traffic to the trial page than the sidebar. More traffic to the trial page means more opportunities to convert. Trials are another very important metric but require a longer testing period to achieve statistical relevance. This continuation of the test is being carried out now for a longer period. For our purposes, it was enough to check whether clicks actually increased significantly with the change in the position of the CTA.
The idea was to activate the fixed bar for 30 days and make a comparison with the sidebar retroactively.
Determining Click-Through Rate
The click rate would be determined through the relationship between visits to pages where the fixed bar was located and the number of clicks on the CTA in a monitored period of time. We calculated it as follows: the number of clicks on the CTA divided by the total number of page views. The result is then multiplied by 100.
Also read: What is Click-Through Rate and How to Increase Your CTR
Collecting Data
To get these numbers, we used two tools: Google Analytics and Clarity, from Microsoft.
Both the sidebar and the fixed bar were applied to all post pages on the English version of the Rock Content blog. This way, Google Analytics provided us with the total number of page views during the monitored periods.
For the CTAs, we created unique links with UTM and were able to count clicks using Clarity. In Clarity, we filtered unique sidebar and fixed bar links for the intervals in which we monitored each bar version.
Test Applied and Comparing Results
The fixed footer bar with the CTA was implemented on the blog on September 19th and, while the test ran for 30 days, we collected retroactive data from the sidebar.
We considered the period between August 19th and September 19th, and the numbers were as follows:
WriterAccess Offer in Blog Sidebar (US&CA)
Period: August 19th to September 19th
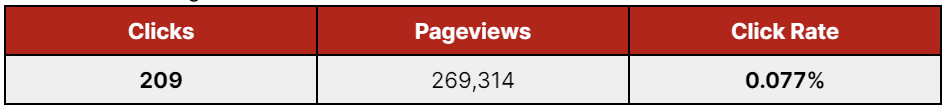
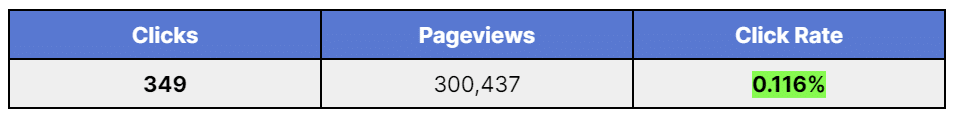
For the test to be a success, the click rate needed to be 10% greater than 0.077%, which is at least 0.084%. After 30 consecutive days of testing, the fixed bar numbers were:
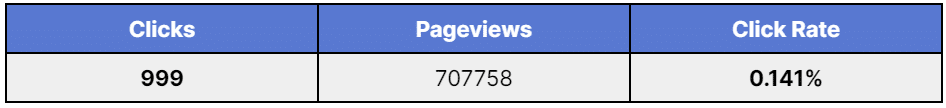
WriterAccess Offer in the Blog Fixed Footer Bar (US&CA)
Period: September 19th to October 19th
Validating the Results
Our results were better than expected, with a 50% increase in the click rate, instead of the estimated 10%.
To gather valuable insights, data should never be read without context. Spikes in clicks can happen due to several factors, such as a promotional period. Therefore, a valuable tip is to always do an extra check of the data and observe whether the timing or sources of data collection are subject to any specific context.
Even with the good results in the initial test, I chose to monitor more periods in subsequent months to see the behavior of the click rate and check for any trends. I did two more rounds of testing with the fixed bar and obtained the following data:
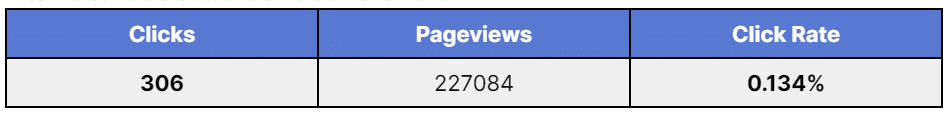
WriterAccess Offer in the Blog Fixed Footer Bar (US&CA) – November
Period: October 19th to November 19th
WriterAccess offer in the blog fixed footer bar (US&CA) – December
Period: November 19th to December 19th
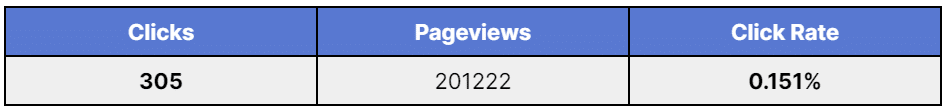
To my surprise, the click rate not only remained the same but also showed an upward trend in the following months, reaching 0.134% in Oct/Nov and 0.151% in Nov/Dec.
Lastly, I calculated the average clicks of the two CTAs during the period in which they were active. This way, we could have a more general notion of how the two versions of the CTAs performed to prove the initial hypothesis:
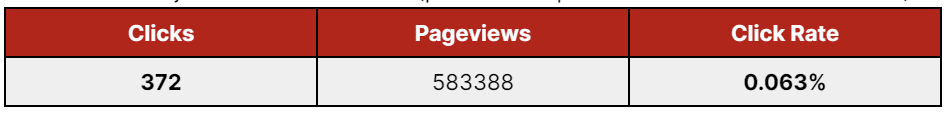
WriterAccess Offer in Blog Sidebar (US&CA) – July to September
Period: July 1st to September 19th (period in which the CTA in the sidebar was active)
WriterAccess Offer in the Blog Fixed Footer Bar (US&CA) – September to December
Period: September 19th to December 29th
With this comparative average, we can see that changing the CTA to the fixed bar at the end of the page more than doubled the click-through rate.
This metric is an important and positive indicator that it was worth questioning user behavior when faced with a certain layout and looking for hypotheses on how to positively impact the click-through rate. This shows how much a “simple” change in positioning can influence metrics and contribute to optimizing the click-through rate.
A test with a heat map might be a good complement to the analysis to see the areas of the screen with the most user activity in each version of the CTA (side or footer bar), even comparing the differences between the two areas dedicated to CTAs in each case.
Conclusions and Lessons
Among the lessons learned throughout this testing process, I would like to highlight that:
- Hypotheses and tests don’t need to be complex. Straightforwardness and ease of implementation are important factors in the ICE Score. The best scenarios are those in which we can identify simple opportunities that bring major, positive impacts.
- It is essential to adopt a reliable methodology, both in establishing parameters and in collecting data. Even using retroactive data in the comparison (as was the case in this test), we need to ensure that the comparison makes sense and is not biased. We should use the same data sources, the same evaluation methods, and, if possible, carry out extra checks to identify trends or specific contexts that could bias the results.
This exercise helps to end the myth of complexity in testing routines, teaching how to observe, structure hypotheses, prioritize, define evaluation parameters, collect data, and generate consistent insights.
It’s something within the reach of not only any marketing professional but also creative professionals. There will always be a new hypothesis to be tested, and doing this in a structured way brings very valuable learning.
![[ROCK NA] [EBOOK SEO] Complete Guide](https://rockcontent.com/wp-content/uploads/2024/06/banner_Search-Engine-Optimization.png)